As of the close today, Thursday, July 27, 2023, a scan of high-volume optional stocks found three new breakout candidates.
AI:
and IQ:
Securities Trading
As of the close today, Thursday, July 27, 2023, a scan of high-volume optional stocks found three new breakout candidates.
AI:
and IQ:
As of the close today, PerfectStorm scan of high-volume optional stocks found two breakout candidates.
AI, and CRM.
CRM:
In the last few weeks, I have investigated a few AI(Artificial Intelligence) platforms in the hope that one or more vendors of this new technology could enhance my trading results.
The quick answer is maybe, but the research has found a troubling example of what could go wrong.
A new ETF that is based on AI is was offered on October 17, 2017: AEIQ.
To quote from its informational site:
“The fund applies proprietary algorithms to artificial intelligence (AI) technology which can process over one million pieces of information per day to build predictive financial models on approximately 6,000 U.S. companies. The technology continually analysis data and models in its active stock selection process, and derives an optimal risk adjusted portfolio consisting of companies with high opportunities for capital appreciation. The fund is actively-managed and discloses all portfolio holdings daily.”
The informational information About AEIQ also states that “The system mimics a team of 1,000 research analysts working around the clock analyzing millions of data points each day.”
“Harnesses the power of IBM Watson.”
The performance of this ETF should answer the basic question that I have had in my investigation; Does AI work?
The answer as it relates to the AEIQ ETF is sometimes yes, sometimes no.
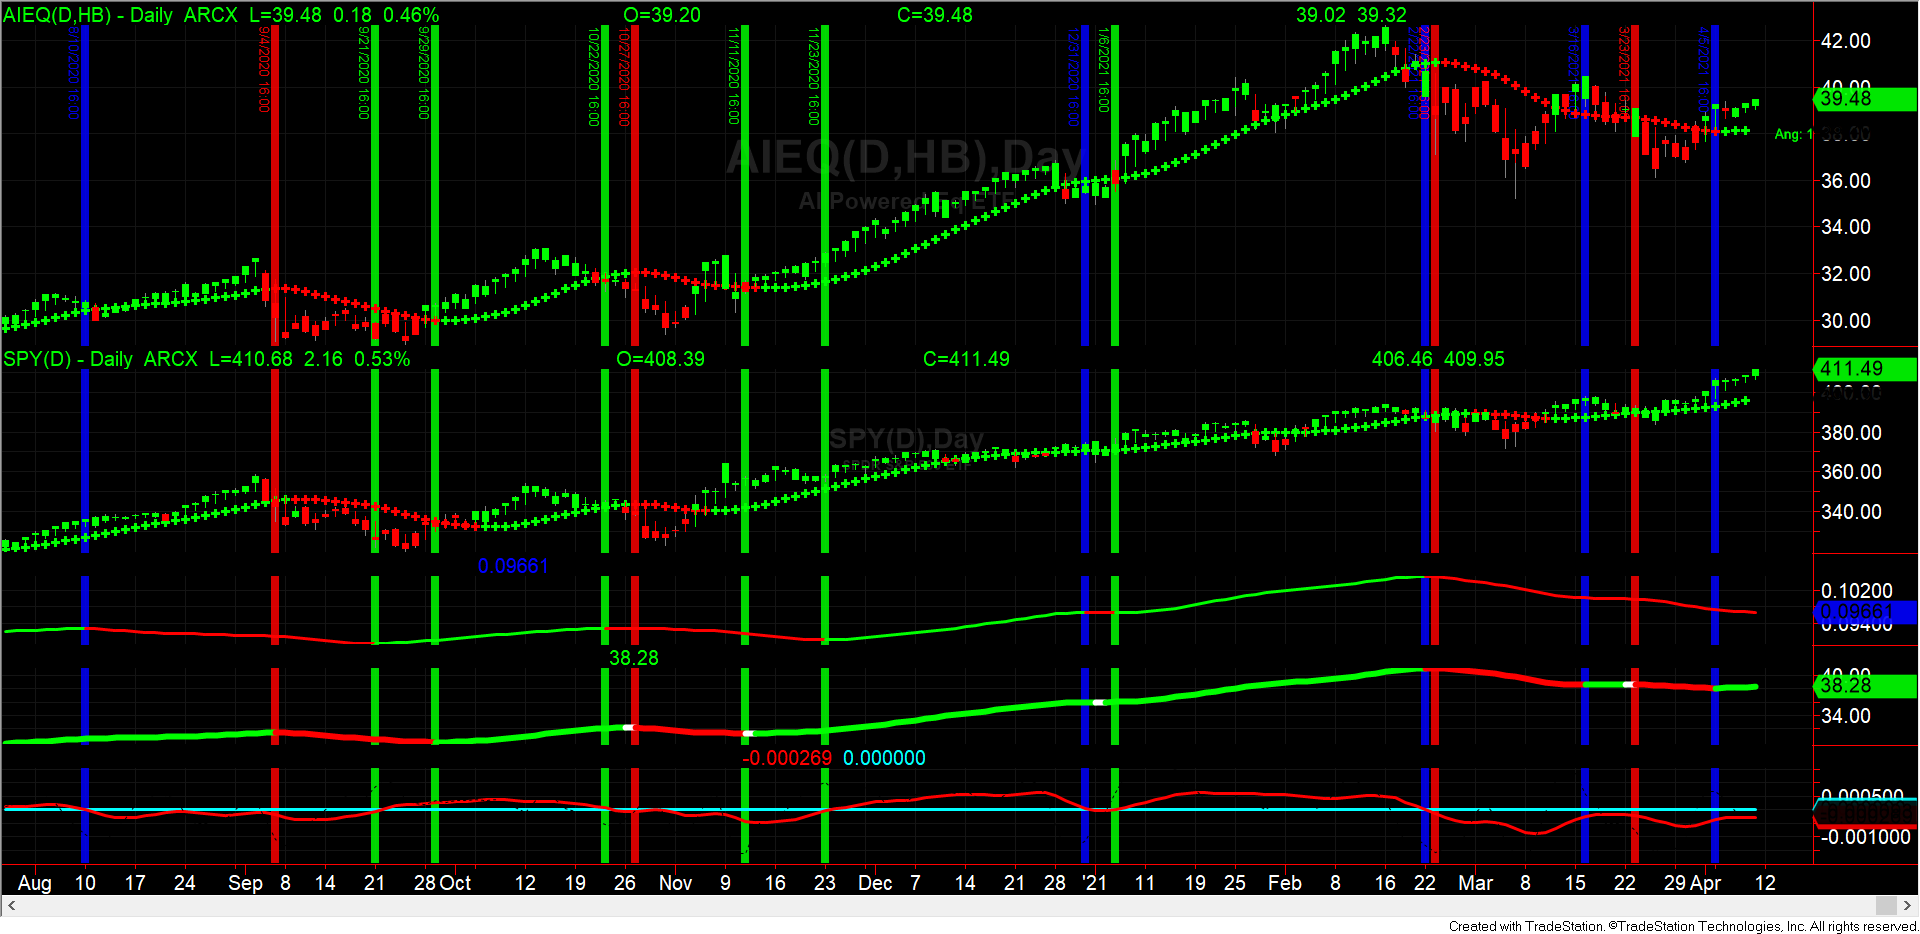
The following graph of the relative performance of AEIQ and the SPY ETF, which represents the S&P 500 index starting in August 2020.

The AEIQ ETF started life on 10/17/2017 at an offering price of $25. On Friday, April 9, 2012, it closed at 39.48, an increase of 57.92%
The S&P 500 on 10/17/2017 was 256.25. It closed on Friday, April 9, 2021, at 411.49, an increase of 60.58%
The above chart, like all the other charts on this bog, has green, blue, and red vertical lines. Green vertical lines are the place where AEIQ is performing, on a relative strength basis, better than the SPY ETF and AEIQ has positive momentum. Red vertical lines show the times that AEIQ is performing worse than the SPY on a relative strength basis and has negative momentum. Blue lines are the indication to close the current position.
The better way to use the AIEQ ETF would be to invest in AEIQ when, on a relative strength basis, it is stronger than the SPY ETF and AEIQ has positive momentum. The basic swing trading method I have been talking about in this blog since day one.
This is the Primary Sidebar Widget Area. You can add content to this area by visiting your Widgets Panel and adding new widgets to this area.
This is the Secondary Sidebar Widget Area. You can add content to this area by visiting your Widgets Panel and adding new widgets to this area.
Copyright © 2024 · Lifestyle Theme on Genesis Framework · WordPress · Log in