Overall Market Signal

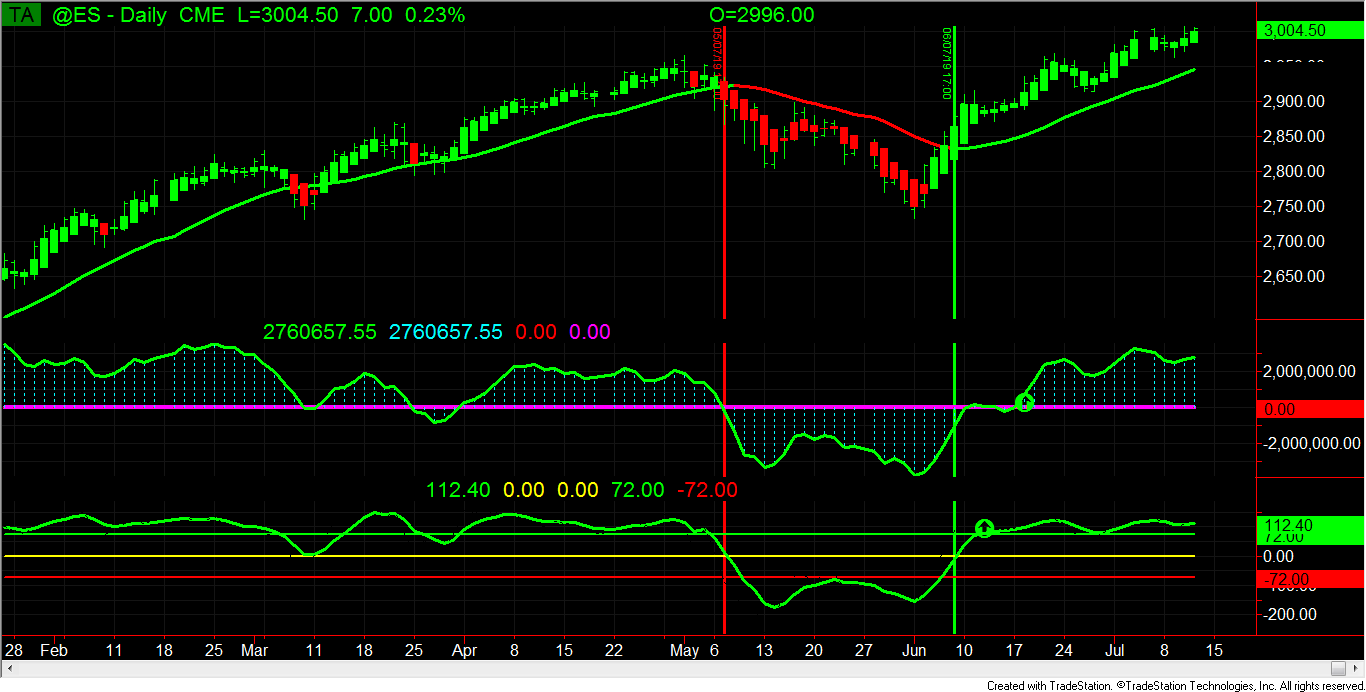
The following chart of the ES Future which represents the S&P 500 index clearly shows that the U.S. equity market, as measured by the S&P 500 index clearly showed a negative daily bias starting at the close of October 4, 2018.

The ES has started to recover in 2019.

For more information on how this kind of quantitative approach can help you with your investment goals, please contact me at rfeit@msn.com or by phone at 516-902-7402.  Also, look at www.medallionreasearch.com for more information.

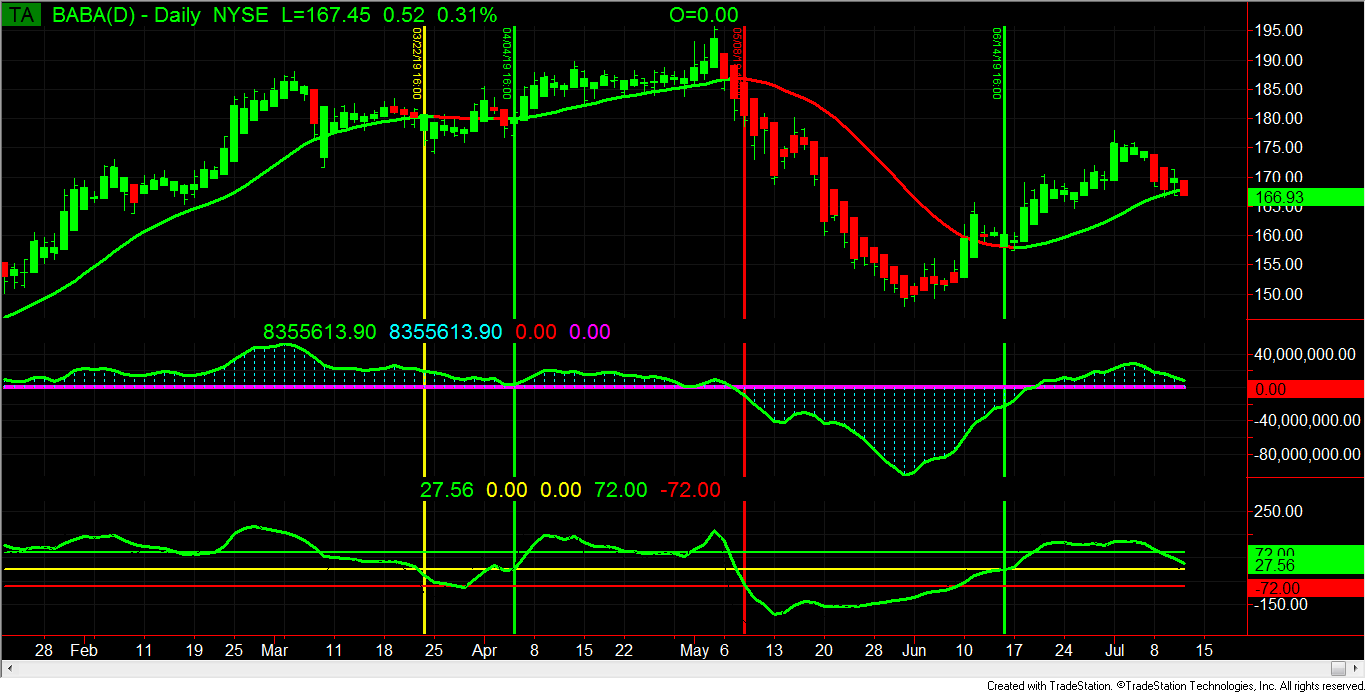
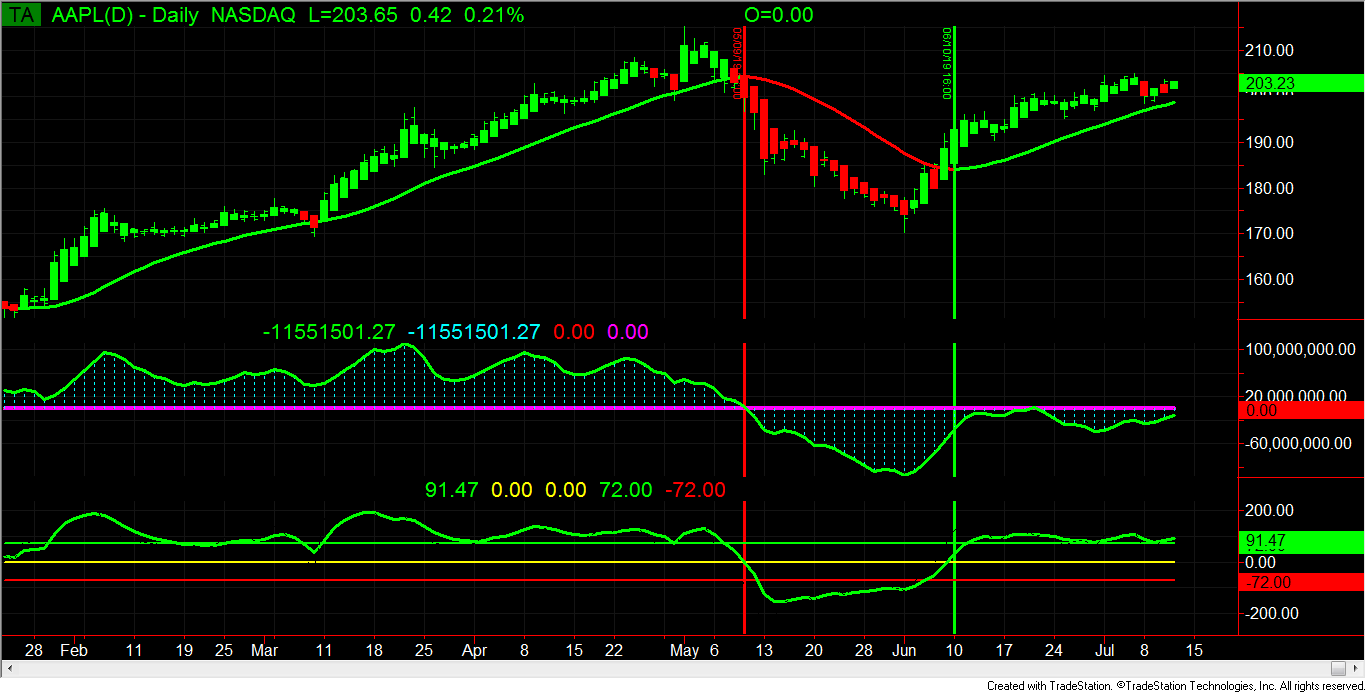
Prices are as of 8 AM, July 11, 2019
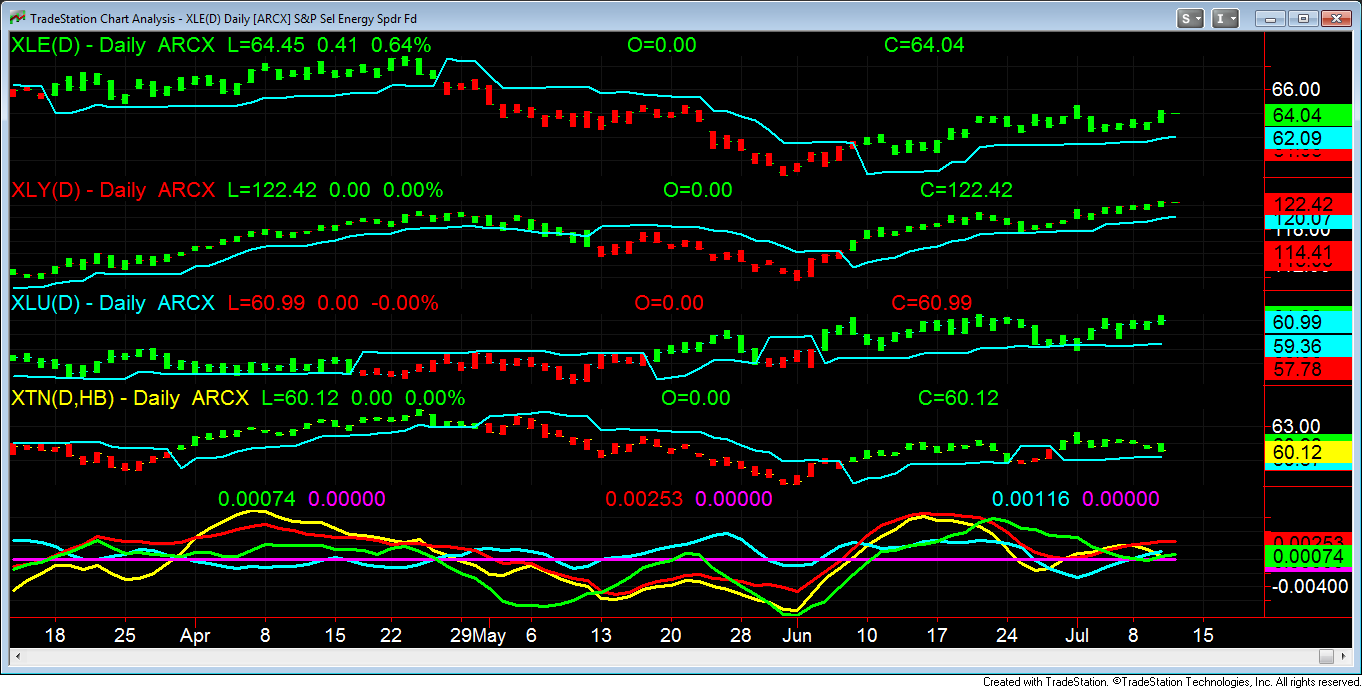
Daily


Alibaba

According to Bloomberg on May 28, 2019 “Alibaba Group Holding LTD. is considering raising $20 billion via a secondary listing in Hong Kong after a record breaking 2014 New York debut, people with knowledge said, a mega-deal that will bring China’s larger company closer to friendlier investors at home as U.S. tensions escalate.”

If this occurs, trading hours will expand to over 20 hours 5 1/2 days a week.

I have attached a daily graph of BABA as of 8 AM today, Thursday, July 11, 2019 below.


Apple

Apple shares declined on news that sales of the iPhone were declining because of the downturn of consumer spending in China. Whether you believe that spin or realize that the costs of the new models do not offer a serious reason to upgrade the older phones is of little concern. Whatever the real reason, Apple stock went down.

Apple is one of the most widely held and more importantly one of the more actively traded stocks in the world. Share and options are traded with very small bid-asked spreads.

From a swing trading perspective, the following attached charts should be of some interest.

Daily prices are at 8:00 on Thursday,  July 11 , 2019:


Relative Strength with Momentum

Readers of the swingtrader.com blog will have noticed that the overall theme that I have proposed is that to be a successful swing trader one has to understand the principle of relative strength with positive momentum.

I originally proposed the concept in an e-book that I had offered in 2000. Because of my lack of web marketing, it was only downloaded a few times, although it was free.

Over the past few months, I have received multiple offerings of momentum services that offer similar strategies that I have been discussing on my swingtrader.com, relativevalue.com and perfectstormtradingstrategy.com websites for the past ten years or more.

One of the offers was a service, using only four ETF’s, that the provider stated would constantly beat the market.

Over the next few weeks and months, I am going to have on the swingtrader.com website an example, updated weekly or daily if necessary, of my 4 ETF strategy. If followed, the strategy should emulate the best of the services being offered. It is certainly not a recommendation of what to buy or sell, but an example of what can be accomplished by using a relative strength with momentum strategy. It is for illustrative purposes ONLY!

The four ETF’s chosen are the result of my own research. They should portray a representation of the changes in market sector rotation. The four ETF’s have a positive and negative correlation with each other. The ETF’s are displayed here on daily charts.

I will update the daily charts when appropriate.

Remember, Green=XLE, Energy. Red=XLY, Consumer Discretionary. Light Blue=XLU, Utilities. Yellow=XTN, Transportation.

Latest update July 11, 2019, 8:00 AM