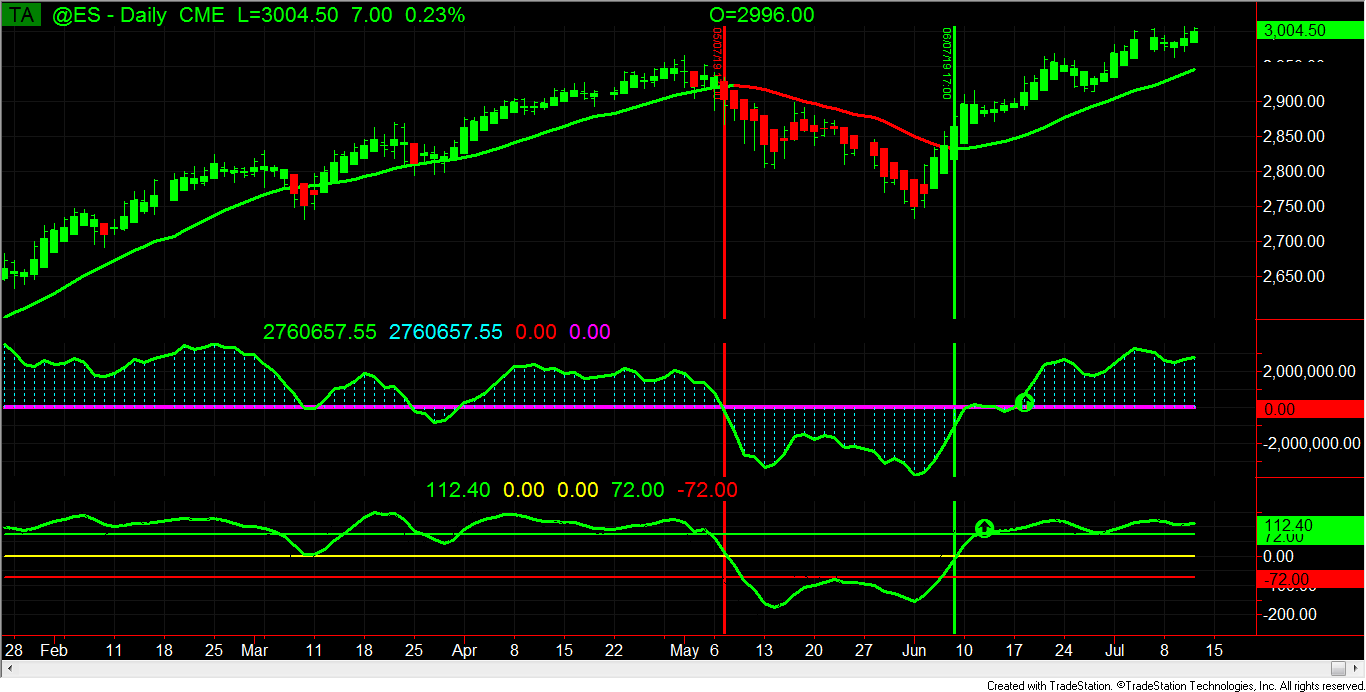
The following chart of the ES Future which represents the S&P 500 index clearly shows that the U.S. equity market, as measured by the S&P 500 index clearly showed a negative daily bias starting at the close of October 4, 2018.
The ES has started to recover in 2019.
For more information on how this kind of quantitative approach can help you with your investment goals, please contact me at rfeit@msn.com or by phone at 516-902-7402. Also, look at www.medallionreasearch.com for more information.
Prices are as of 8 AM, July 11, 2019
Daily
