Many times I have been asked if the PerfectStorm strategy that works so well for swing trading has any use for the thousands of traders who day trade. Perhaps the following illustrations will be helpful. All graphs are as of the close of business of Friday, June 5, 2020.
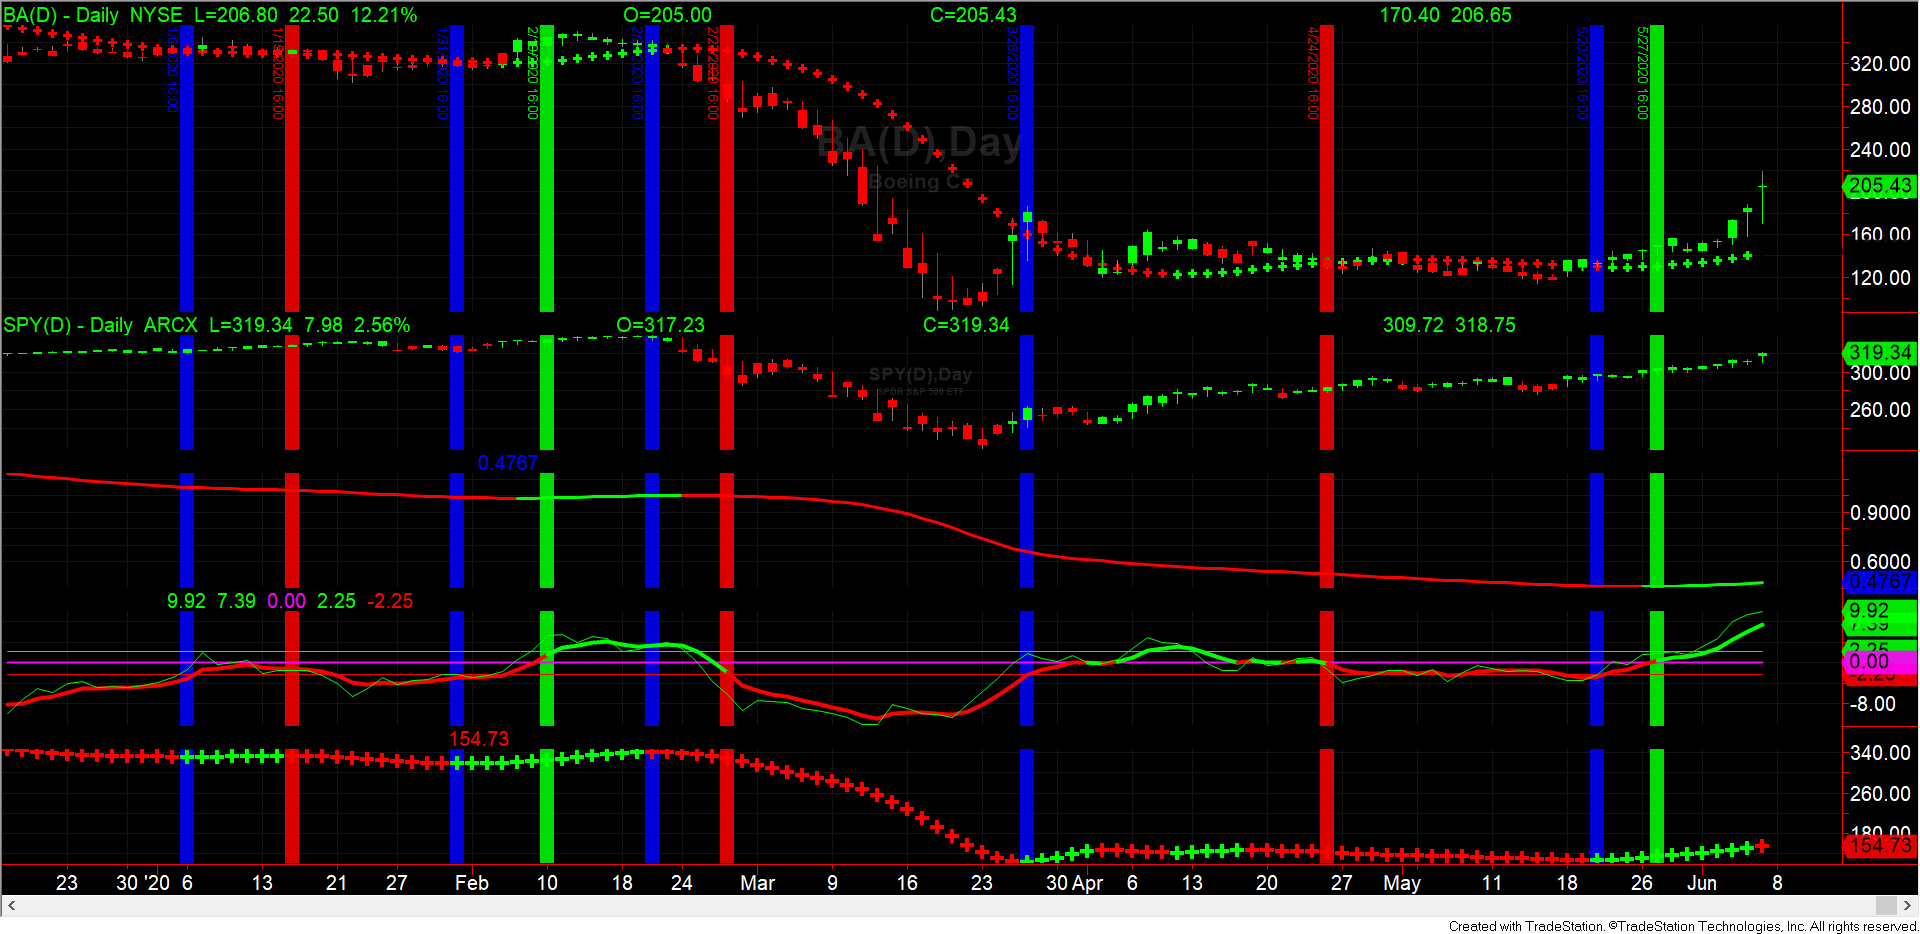
The above picture is the daily results of BA versus SPY.
The top is BA, and the next security is SPY. The next line represents the relative strength of BA versus SPY. When the line is going up and GREEN, BA is stronger than SPY. When the line is going down and RED, SPY is stronger than BA.
The Vertical lines represent, when GREEN, that BA should be bought. When the vertical line is BLUE, the trade should be closed. When the vertical line is RED, BA should be short. Many hedge funds, when the trade indicates, will be short the opposite security, that is, when indicated long BA, they will be short SPY and vice versa.
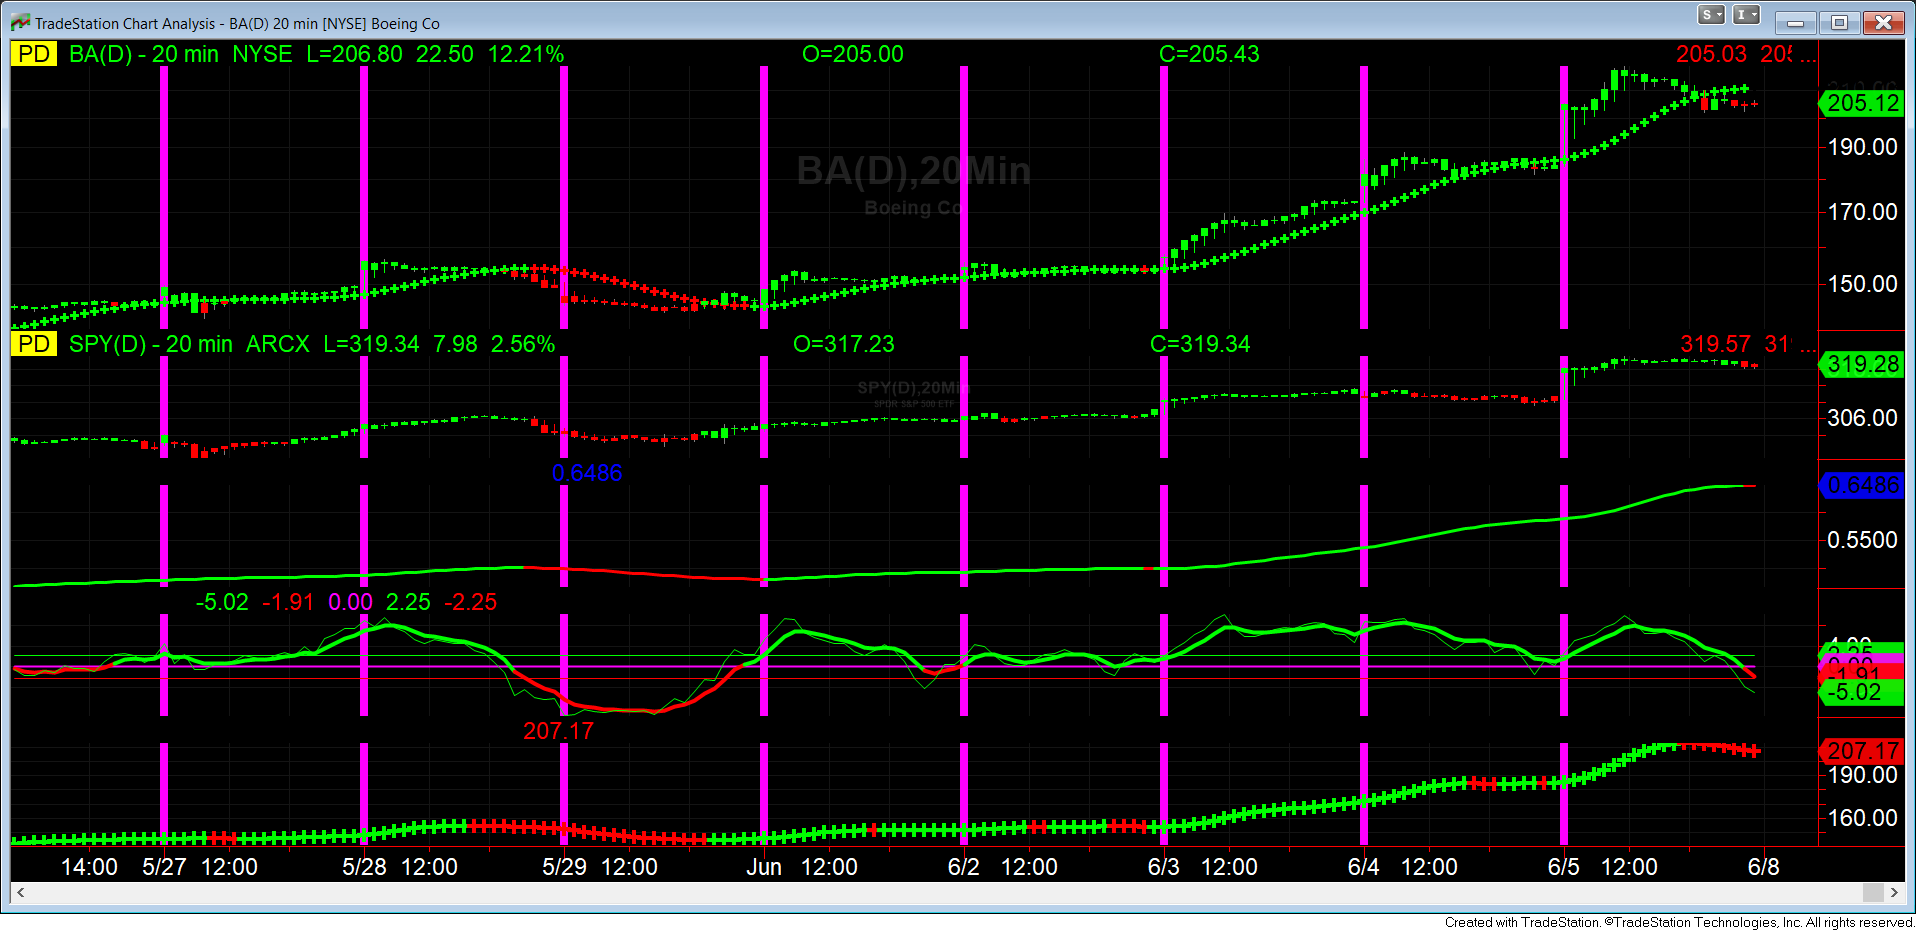
The next picture is of BA versus SPY on a twenty-minute basis. I have left off the vertical signal lines, but a careful analysis will dictate the long/short position.
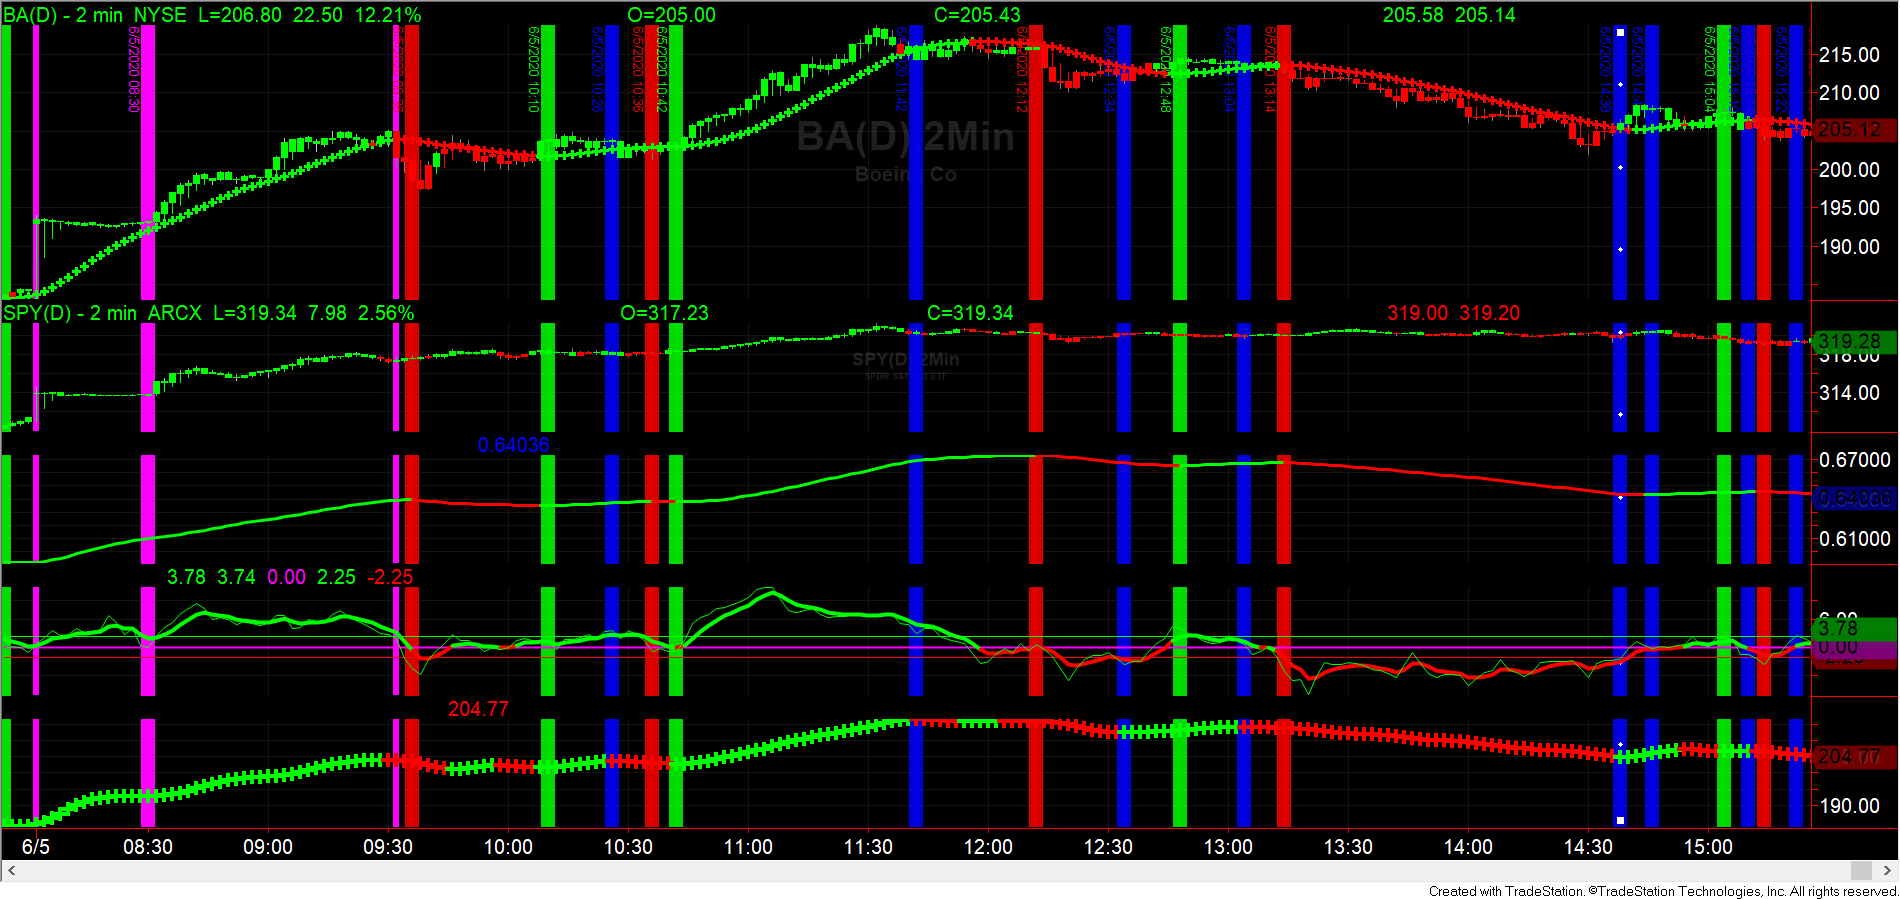
The next picture is of BA versus SPY on a two-minute chart.
There are thousands of “pairs” that can be traded in the same manner. Just ask Medallion Fund, or Citadel, or World Quant or the many other Quant funds.
I can be reached for further information at rfeit@msn.com or (516) 902-7402