I have been asked by many viewers of this blog for more information on the basic swing trading strategy.
As is true in day trading, a multiple time frame analysis will lead to better success than just looking at an individual time frame.
The longer-term, in this case, weekly, is the signal that determines which way the security is going, i.e. the long term direction.
The shorter time frame, in this case daily, is the signal to follow in the same direction as the longer time frame, weekly.
I am using FedEx (FDX) for this example. The up arrows indicate long, down arrows indicate short. Blue vertical lines indicate neutrality.

We can see by the above chart, that FDX was in an uptrend starting on July 10, 2020.
Swing trading decisions from that date until January 1, 2021, should only be on the buy-side.
The chart below is the daily chart of FedEx, the shorter time frame that should be used to make the actual decision.
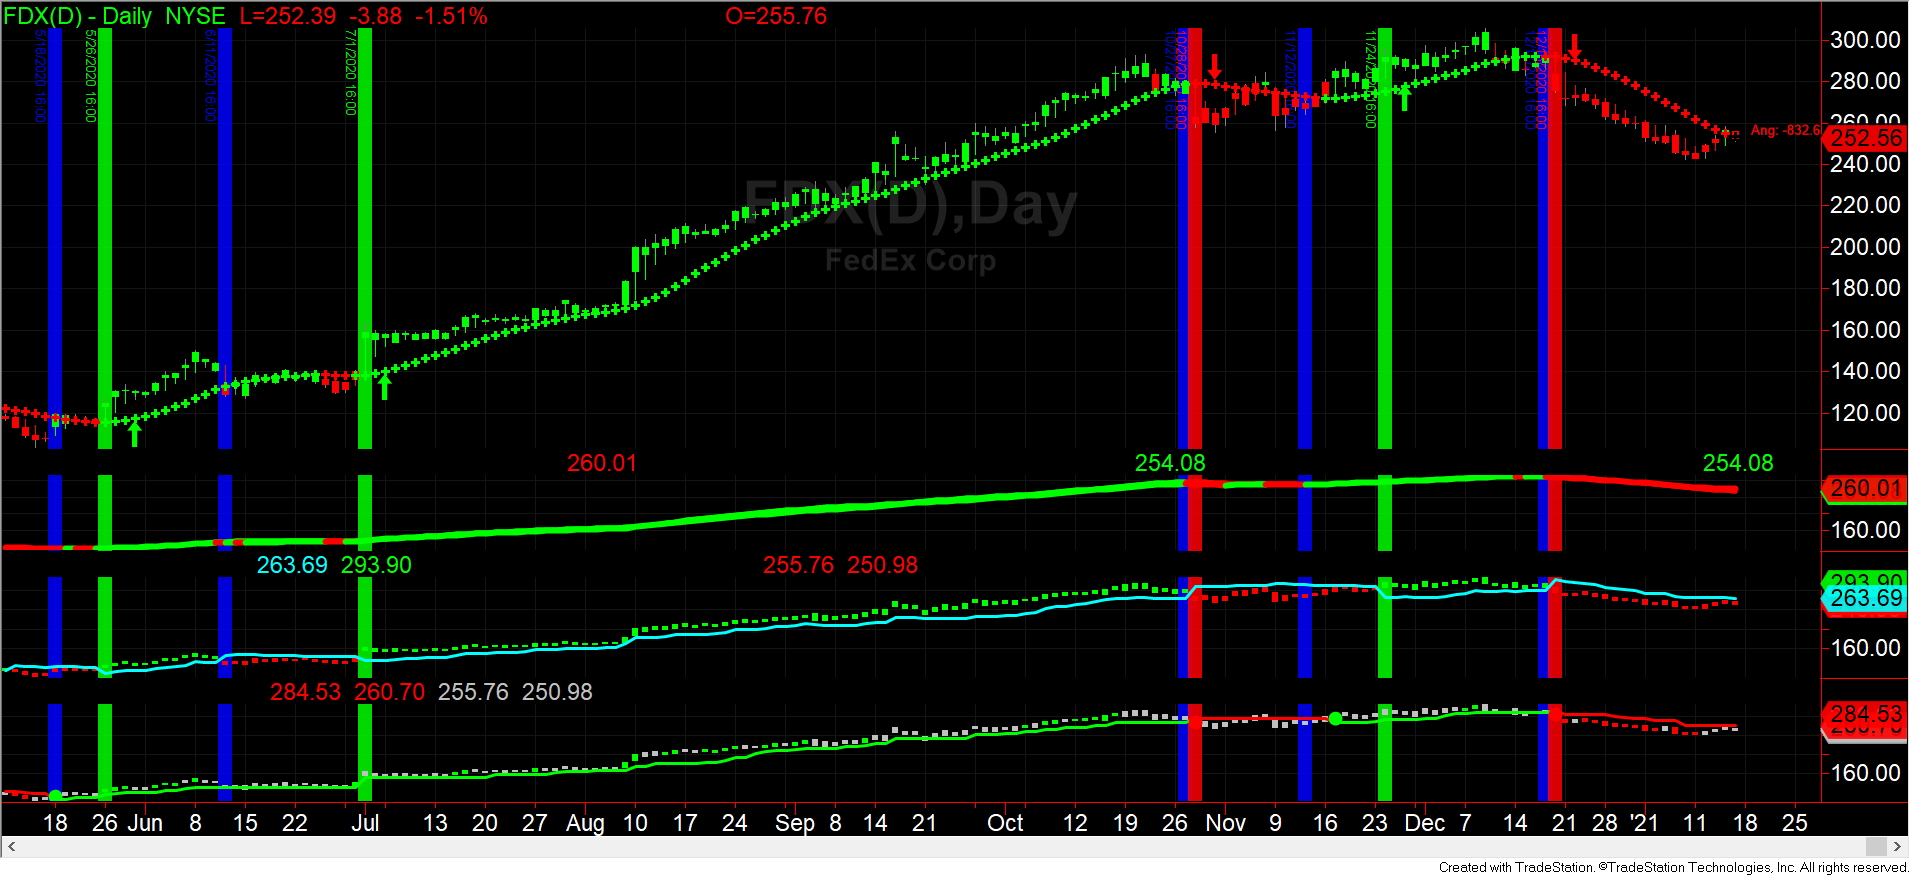
On July 11, 2020, the opening price of FedEx was $160.00 and a buy decision could have been made based on the weekly signal.
The initial long position could have been closed, October 28, the day after the neutral signal, at a price of $262.73, the opening price.
As in any trading decision, proper trade management should be used, such as stops.
This is only an example of what could have been done, not any kind of recommendation on FedEx or any security mentioned in any of this blog. Illustrations ONLY.