Paypal has been one of the more active stocks for the last few weeks.
Obviously, someone or a group of someone had a head start on the decline.
The following graph of the weekly activity should be helpful in coming to that conclusion.

In October of 2021, the decline began.
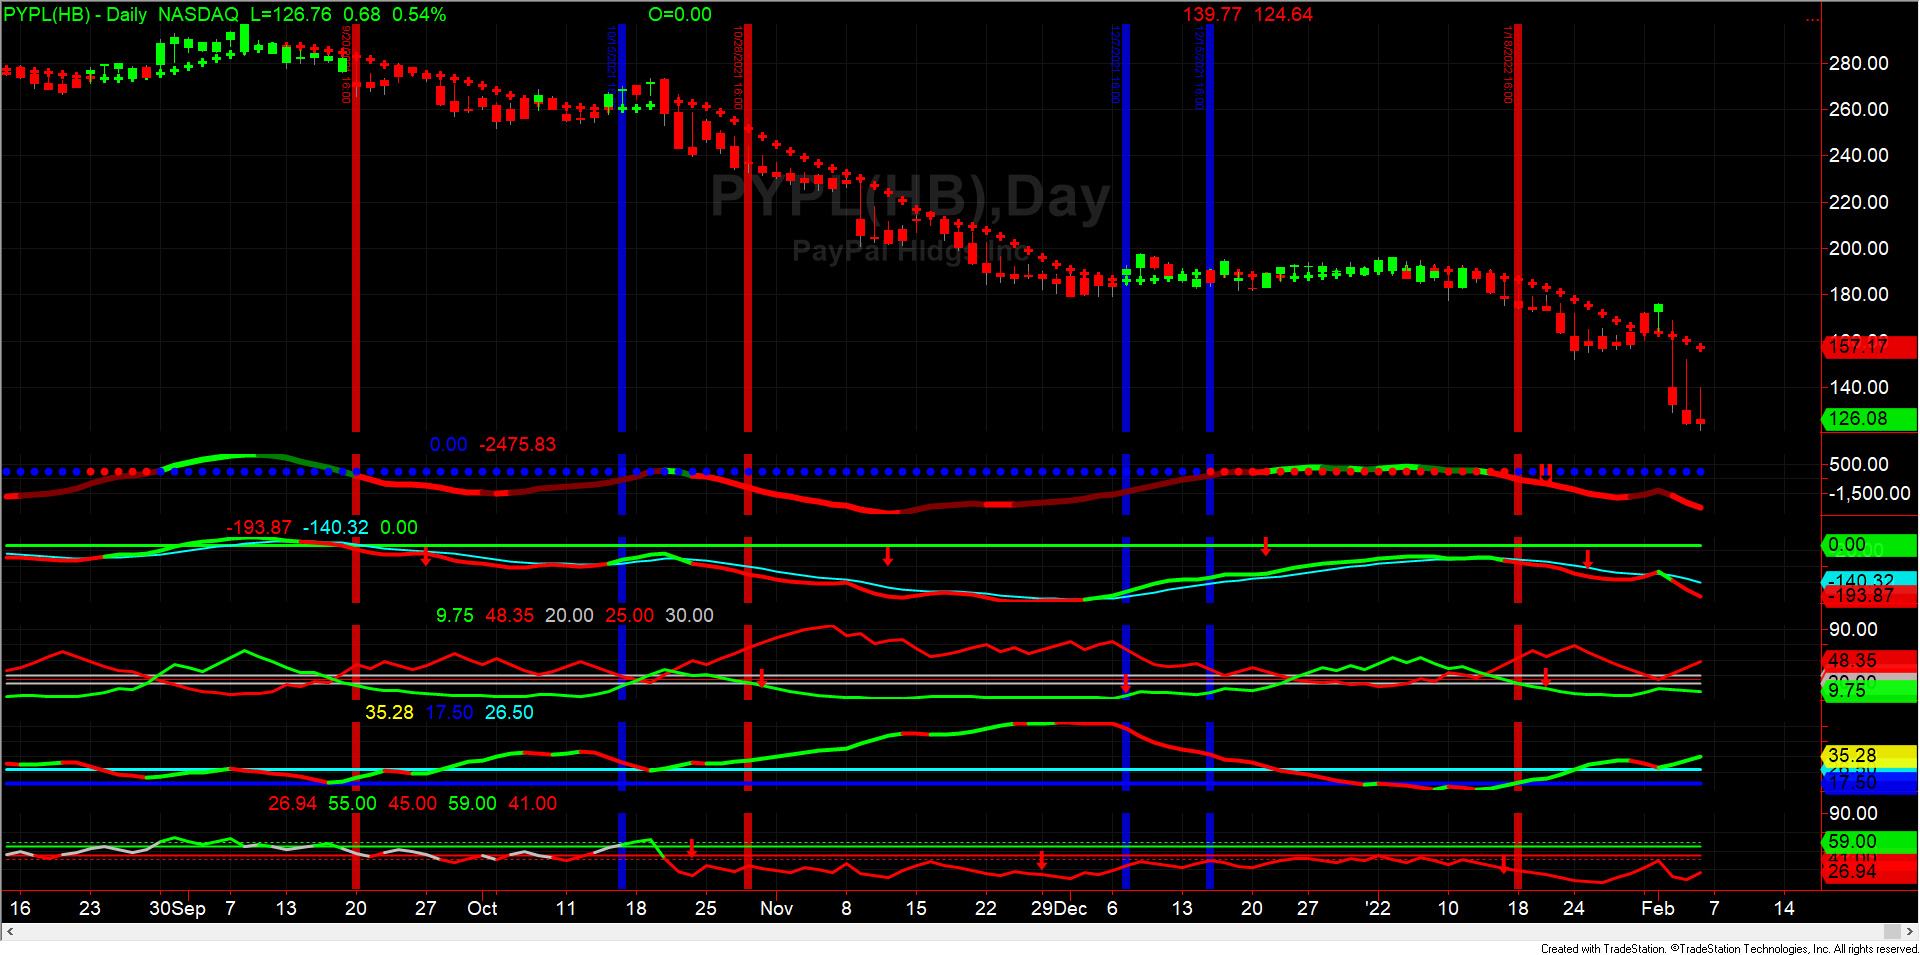
The daily chart should through further light.
As in all previous charts, the red line signifies SELL, the Green line, BUY, and the Blue line indicates close out the previous position