One of the groups that are active in LinkedIn is Automated Trading Strategies(Algorithmic Trading of Stocks,…). A current questions is about the VIX and the SP500.
The VIX, first introduced by the CBOE in 1993 using the S&P100 (OEX) was a weighted measure of the implied volatility of at the money put and call options on the S&P 100. Some years later it was changed and is now based upon the S&P500 index. The ETF of the S&P500 is SPY. The VIX index is often called a fear index by traders because in most cases when the market is calm and moving in a narrow trading range, volatility is low. As the market sells off, anxiety among traders increases and volatility increases. The VIX raises in periods of higher volatility.
The VIX tends to move in an opposite direction as the S&P500.
The following chart of the SPY versus the VIX for the daily period ending January 10, 2014 should illustrate that point.
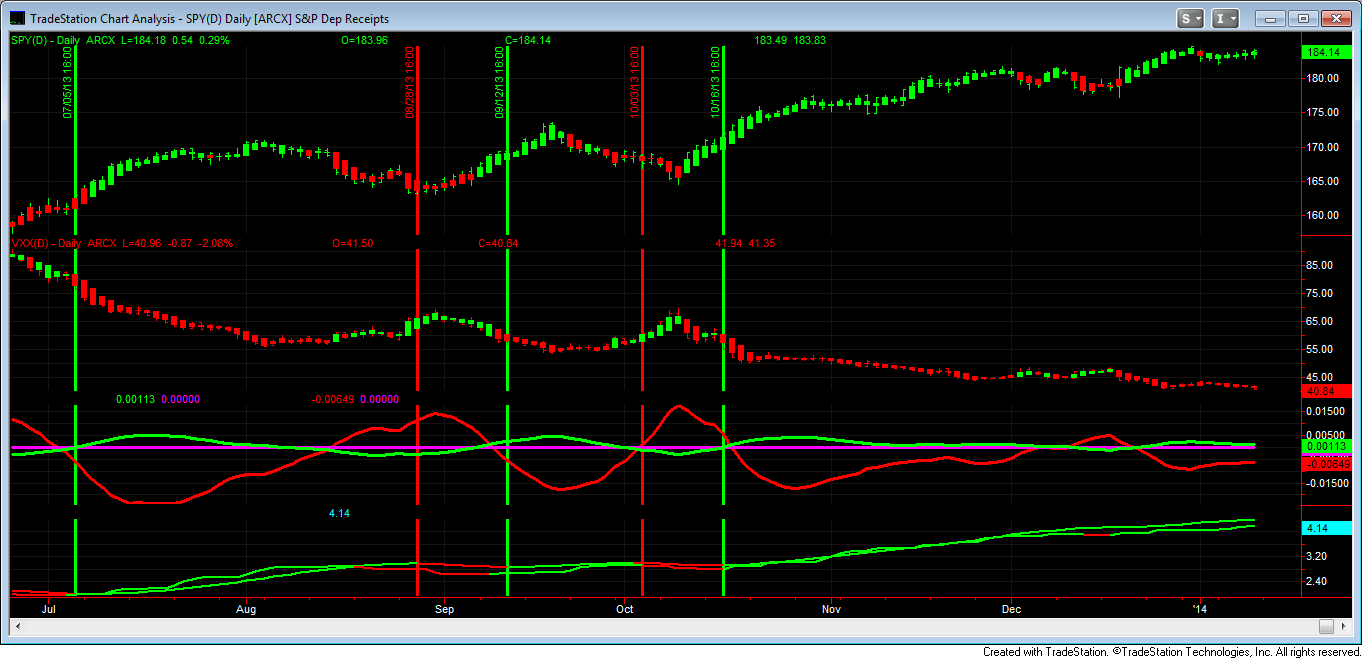
The top wriiten symbol in green is SPY, the bottom security with the symbol written in red is the VIX.
The chart clearly illustrates that as the SPY rises, the VIX declines. As SPY declines, VIX rise.
The vertical lines indicate turning points in the direction of the SPY and the VIX. Green lines tell the trader to purchase SPY, the symbol written in green and sell VIX, the symbol written in red. Red vertical lines indicate the decision to purchase VIX the red symbol and sell SPY the green symbol.
The latest trading decision was indicated on October 16, 2013. Buy SPY, sell VIX.
If a trader had purchased SPY the next day at the high of 173.32 and held it through the close of 184.14 on January 10, 2013,it would represent a profit of 6.24%. A sale of VIX at the low of the next trading day after October 16 at 52 and still holding the sale through the close of 40.84 on January 10, 2014 would represent a 27.3% profit.